Map Reading Learning Objectives
After completing this section you should be able to:
- Identify common topographical map symbols
- Read and interpret contour lines
- Orient a map based on local topography
- Identify and explain the basics of coordinate systems
- Identify and interpret longitude and latitude coordinates
- Identify and interpret UTM coordinates
- Identify and interpret Township and Range coordinates
Introduction to Topographical Maps
A navigation map represents our three-dimensional world on a flat piece of paper.
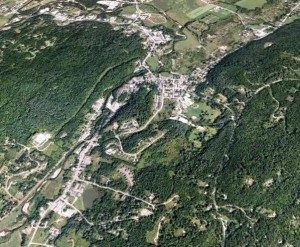
We might imagine if we were flying high in an airplane, we could simply take a picture of what we see and that could be our map. Although aerial photos can be helpful, they do not make particularly good navigation maps.
They contain too much information, making the important information difficult to find. Photographic images can also be ambiguous. Is that a road, a river, a power line, a railroad or what? A simplified drawing with consistent and intuitive symbols is far more useful.
Identify common topographical map symbols
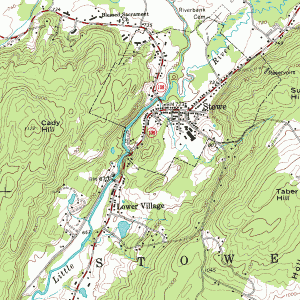
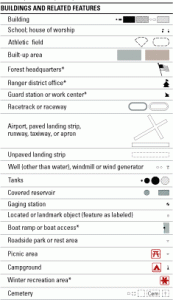
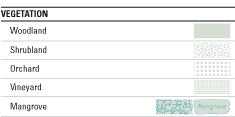
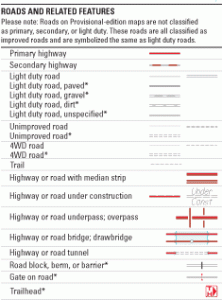
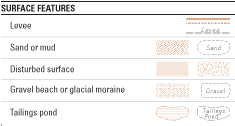
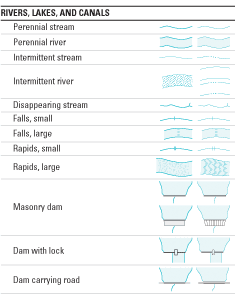
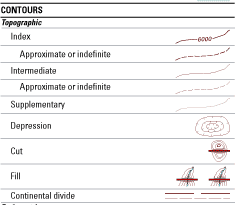
For the outdoor enthusiast, the most useful map is a topographical map. In addition to indicating vegetation, waterways, landmarks, roads and trails, it also contains information regarding elevation. Map providers offer detailed legends, though often not on the maps themselves. Frankly, if you included them all, they might be bigger than our maps. Thankfully, most symbols on a topographic map are fairly intuitive. You will not be surprised that green areas have vegetation, where white areas are more barren. Blue indicates water, such as lake, river or stream. Black double dotted lines are dirt roads, and single dotted lines are trails. Here are just a few of the typical legends for topographical maps.
  |
  |
|---|
Traditional 7.5 Minute Topographical Map
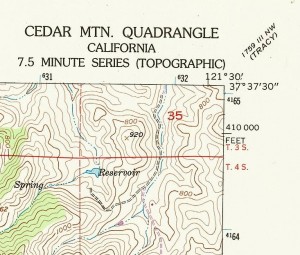
The most commonly used outdoor topographical maps, provided by the USGS, are the 7.5 minute maps.
Note: a minute is one 60th of a degree, and not a measure of time. 7.5 Minute refers to the fact the map covers an area 7 minutes and 30 seconds of longitude by 7 minutes and 30 seconds of latitude.The title of the map is indicated in the upper right hand corner. Pictured is the Cedar MTN Quadrangle. For each map, there are 8 adjoining maps, 1 on each side, and 1 on each corner. The Tracy Quadrangle butts up with this map in the upper right corner.
 The map scale appears on the bottom center of the map, and is listed as 1:24,000, meaning that any measure of the map would be expanded by 24,000 to match the actual environment. In other words, and inch of the map equals 24,000 inches in the field. The scale also indicates the translation to miles, feet, and kilometers for quick distance calculations using a ruler, a finger or piece of string. The contour interval is indicated as 40 feet, meaning that the elevation change between any adjacent brown lines is 40 feet (either up or down).
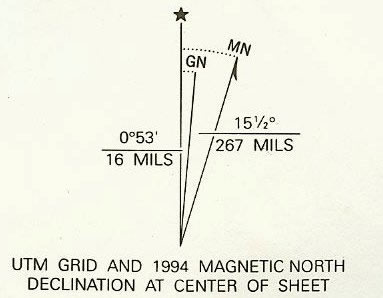
For consistency, the top off a topographical maps is oriented to true north (which is not the same as magnetic north). In other words, unless clearly indicated otherwise, it is safe to assume that the top of the map represents north, the right side east, the bottom south, and the left west.
Note: MN is is magnetic north, and GN is Grid North. both of these will be explored later.Read and interpret contour lines
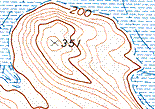

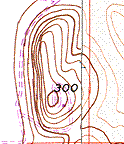
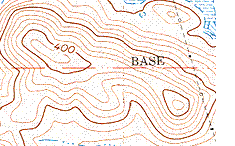
Perhaps the least intuitive symbols on a topographical map (and the most important) are the contour lines. These brown wavy non-crossing lines seem to dominate the entire map, yet they do not represent anything physical like roads or trails. What they do represent is a constant elevation. Every point along a brown contour line is at the same elevation. The darker thicker brown lines are index contours. These lines typically have an elevation number printed on them (such as 400, or 2800). The lighter thinner brown lines are known as intermediate contours. They also represent an elevation level, but to avoid clutter, do not have a printed value. In most cases, there are 4 intermediate contour lines between each index lines. The difference in elevation between lines is indicated on the map as the “contour interval”. A typical contour interval is 40 feet or 80 feet. If you can’t find the interval listed, you can calculate it yourself by taking the difference between two parallel index lines, and dividing by five. For example if, if you see 4 intermediate contour lines between an index line marked 3000 and an index line marked 2800, you can figure the interval as (3000-2800 = 200) / 5 = 40 feet.
To visualize what contour lines are telling you, imagine that you are walking along one line. You would wind along following the curves of the terrain, but never go up and never go down. If you do turn and cross a contour line, then you are changing elevation, either up or down, by the contour interval. You can tell if it is up or down by comparing the values in the closest index lines. The closer the contour lines are to each other, the stepper the slope. Lines extremely close, or seemingly on top of each other, represent a sheer cliff
To practice your contour skills, see if you can match up the contour lines with the most logical profile.
1
|
|
|---|---|
B
|
2
|
C
|
3
|
D
|
4
|
Answers: A-4, B-3, C-2, D-1
Contours for Ridges and Valleys
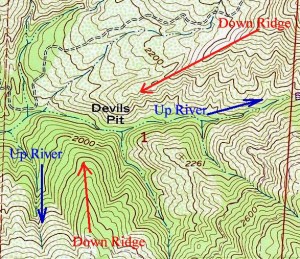
Ridges and valleys can be identified by a pattern of stacked “V” shapes. One common point of confusion, however, is that the direction of elevation gain represented by the “V” changes depending on if it is a ridge or a valley. For ridges, the “V” points down hill. For valley’s, the “V” points up hill
Notice the example at Devils Pit. The red arrows are pointing with the “V”, which is down the ridge line. Notice the blue arrows are also pointed with the “V”, but in this case it is pointing up creeks not down. Water typically flows down valleys, not ridge lines, so water flows “against” the “V”, not with it.
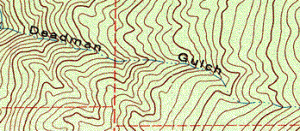
Practice:
When the Deadman Gulch has water, does it flow right-to-left or left-to-right?
Answer: Right-to-Left
Orient a map based on local topography
Orienting a map means turning the map until it is properly aligned with the surrounding environment.
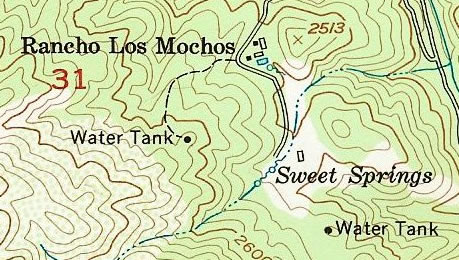
In other words, if the map was laid flat on the ground, true north would be the same direction as the top of the map, east would be to the right of the map, south would be towards the bottom, and west to the left of the map. Even without a compass, you can orient a map by comparing it to known visible landmarks such as mountain peaks, rivers, lakes or structures.
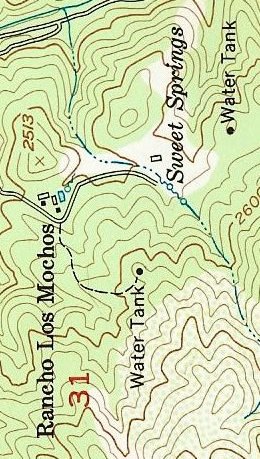
For example, lets assume you know you are standing near Sweet Springs, and you can see the Rancho Los Mochos buildings off in the distance to your left. To orient the map, you would rotate it so that the buildings were off to your left.
Now that the map is properly oriented to your surroundings, you can easily tell that North is to your left, toward the buildings, and you are actually facing east.
Identify and explain the basics of map coordinate systems
What is a coordinate system?
A coordinate system is a method to use a number or combination of numbers to represent a unique position.
![]() For example, in one-dimension, a single number could be used to identify each unique position. Imagine a line with a reference point of zero(0). Positions to the right could be given successively increasing positive values, and positions to the left could be given assigned negative numbers.
For example, in one-dimension, a single number could be used to identify each unique position. Imagine a line with a reference point of zero(0). Positions to the right could be given successively increasing positive values, and positions to the left could be given assigned negative numbers.
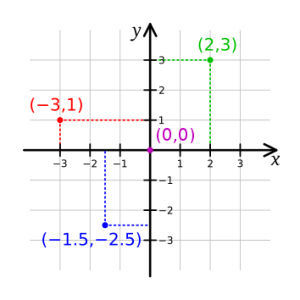
In a two-dimensional representations, two numbers are required: one for each dimension. For example, in a classic Cartesian x,y coordinate system, perpendicular lines are used to create a grid system. Each position is represented by a unique combination of x and y values.
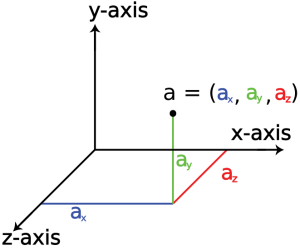
In a three-dimensional representation, a third value is added. This system is often refereed to as an x,y,z system. Each position in space is represented by a unique combination of three values.
Polar Coordinate System
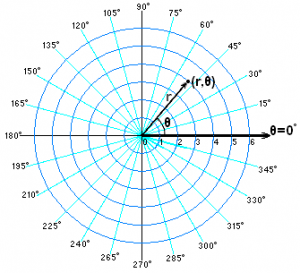
Another coordinate system uses distance and angle from a reference point. For example, two dimensions can be referenced by two numbers, one representing the distance from the point, the other reference the angle (360 degrees).
Map making challenges
A map is a two dimensional representation of the surface of the earth, which is an odd shaped sphere, with a very irregular surface of mountains, valleys and plains. If we simply pound our earth ball until it is flat, something has got to give. We will be distorting some dimension of the original globe. It might be shape, it might be distance, it might be area, but something has got to give. The technique used to project this globe onto a flat surface determines the compromise strategy. Some maps project as if the paper map is on a plane, some project as if the map is on the surface of a cylinder, and others project as if the map is on the surface of a cone. A topographical map will typically indicate the projection system used. Many USGS maps uses a Lambert Conformal Conic projection, which does a nice job of preserves angles and a good job with distances (both important for navigation).
Identify and interpret longitude and latitude
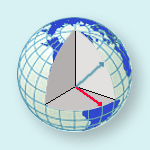
Perhaps the most common way of dividing up the earth is in degrees of Longitude and Latitude. Longitude lines are the up and down lines that are used to measure east to west. Latitude lines are horizontal lines, used to measure north to south. Longitude is represented by the range of values from +180 (east) to -180 degrees (west), with zero(0) representing the prime meridian (which passes through Greenwich England). Latitude is represented by the range of values from +90 (north) to -90 (south) with zero(0) being the equator.
To increase the precision, degrees are often further broken down into minutes and seconds. A minute is a 60th of a degree, and a second is a 60th of a minute. San Francisco can be represented as:
- Latitude: 37 degrees, 42 minutes, 44 seconds North
- Longitude: 122 degrees, 57 minutes, 03 seconds West
Be aware Latitude/Longitude and is also sometimes represented in a degrees decimal form. For example San Francisco can also be represented in decimal form as:
- Latitude: 37.7123285
- Longitude -122.95081
Topographical Map Representation of Longitude and Latitude
 Because of it’s popularity, topographical maps almost always contain longitude and latitude values, expressed in degrees, minutes and seconds.
In this sample map, the right hand longitude is listed as 121 degree, 30 minutes, and 0 seconds (zero is assumed and not explicitly printed). The upper left corner (not shown) lists 121 degrees, 37 minutes, and 30 seconds. If you are correctly doing the math, you will find the difference between the right and left edges of the map is indeed 7 minutes and 30 seconds (or 7.5 minutes) . Similarly, in the upper right hand corner the latitude is listed as 37 degrees, 37 minutes, and 30 seconds. Can you guess what the lower right had corner lists for latitude? If you guessed 37 degrees, 30 minutes, and 0 seconds, you are correct. Again, 7.5 minutes of latitude between the bottom and top of the map.
Although very popular, there are some challenges to representing this curved system on a two dimensional grid. Degrees north and south represent a relatively consistent distance on the earths surface (110-111 kilometers per degree). Degrees east and west, however, range from 111 kilometers per degree at the equator to zero (0) kilometers at the poles. The potential inconsistencies in scale, makes it less useful for navigational calculations.
Identify and interpret UTM (Universal Transverse Mercator)
In order to achieve a more “square” grid for navigation, other systems have been created: the most popular being UTM (Universal Transverse Mercator). In this system the earth is divided up into 60 zones (each 6 degrees of Longitude wide)
According to the USGS Fact Sheet 077-01 August 200:
These zones are numbered consecutively beginning with Zone 1, between 180° and 174° west longitude, and progressing eastward to Zone 60, between 174° and 180° east longitude. Thus, the conterminous 48 States are covered by 10 zones, from Zone 10 on the west coast through Zone 19 in New England.. In each zone, coordinates are measured north and east in meters. (One meter equals 39.37 inches, or slightly more than 1 yard.) The northing values are measured continuously from zero at the Equator, in a northerly direction. To avoid negative numbers for locations south of the Equator, NIMA’s cartographers assigned the Equator an arbitrary false northing value of 10,000,000 meters. A central meridian through the middle of each 6° zone is assigned an easting value of 500,000 meters. Grid values to the west of this central meridian are less than 500,000; to the east, more than 500,000
Because UTM represents an actual distance in meters, rather than an expression of degrees representing a varying distances, it is much easier for us to apply this information in the field. For example, it is much easier to understand needing to be 240 meters east, than say needing to be 15 seconds east.

UTM is also listed on the edge of the map, as a secondary coordinate system. This grid system is in thousands of meters, and is indicated by small blue ticks. On this map you will see the numbers 6-31, 6-23 across the top, and 41-65 and 41-65 down the side. Because the ticks represent thousands of meters, they therefore represent a distance of 1 kilometer between each mark.
Much like Latitude and Longitude, every location has a unique combination of two UTM values. A typical example of UTM (San Francisco again) would be:
- Easting: 504335.56653118564
- Northing: 4173899.1894010305
This values are expressed in meters.
Identify and interpret Township and Range
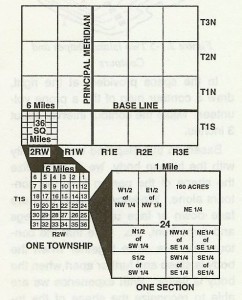
Many topographical maps also include Township and Range coordinate information. These appear on your topographical map as a brown square (approximately 1 mile by 1 mile) with a brown number in the center of each square (ranging from 1-36).
The Township and Range grid is centered relative to a principle meridian (running north to south) and baseline (running west to east). A township is 6 miles north to south. A range is 6 miles east to west. They are referenced in the margin of the topo map as something like T4S for Township 4 South, and R3E for Range 3 East. Each 6 mile square intersection of town and range is further divided into 36 square mile sections, whose numbers snake consecutively from the upper right hand corner as 1, across left to 6, down a row as 7 and back across right to 12, down a row to 13, and so on until it ends with 36 in the lower right hand corner. To increase the precision, each square mile section is further divided into quarters referred to as North West, North East, South East and South West. And for even more fun, each section quarter is divided yet again in to quarters. As an example and area may be referenced as the
north-west quarter of the south-east quarter of section 24 township 1 south and range 2 west
It is covered here because brown squares and section numbers appears on many topographical maps, and can be confusing if you don’t know what they are. Luckily, UTM and Longitude and Latitude are really the only ones used by wilderness navigators, so you might want to forget I even brought it up.
Map Reading Review
You should now be able to:
- Identify common topographical map symbols
- Read and interpret contour lines
- Orient a map based on local topography
- Identify and explain the basics of coordinate systems
- Identify and interpret longitude and latitude coordinates
- Identify and interpret UTM coordinates
- Identify and interpret Township and Range coordinates

